
As we were unexpectedly in the house struck down with the dreaded chicken pox last week, we were all getting a bit restless and fed up. By day three whilst still contagious we decided we HAD to get out into the nice weather. We therefore got the balance bikes out and headed out onto our road.
The road we live on is quiet so I knew we would be unlikely to come across anyone who might catch the pox so I felt quite relaxed about being out, and we all needed the fresh air. After a good hour of zooming up and down on their bikes the children asked what else they could do.

We decided to do a survey of the cars on our road. The children got their clipboards (it’s amazing how much more exciting everything is with a clipboard) and they decided to do a survey of car colours and car makes.
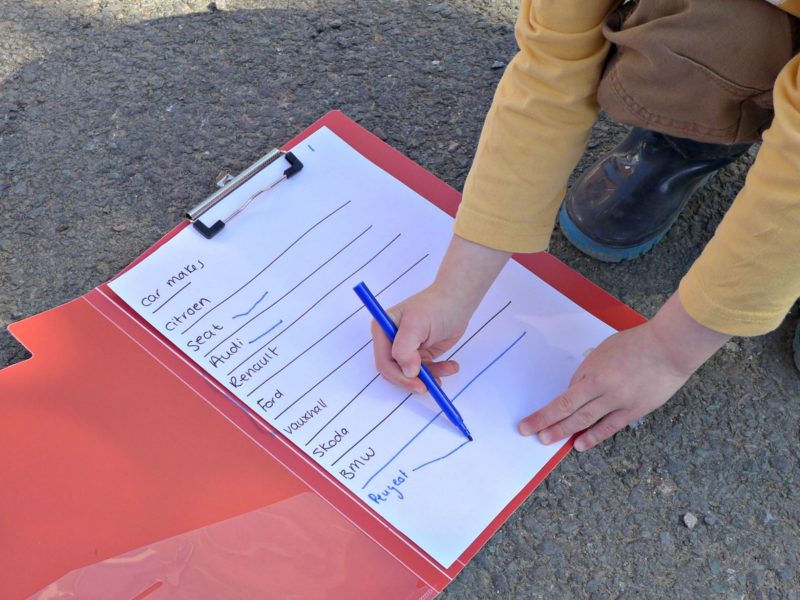
I drew up a list of car makes for Mr D and did a list of colours for Miss E. We then set off up the road to check the different models and colours. I was quite surprised at how many makes they already knew and it was nice to see Mr D try to work out the words on the paper. They marked each car they saw and we spent a good 45 minutes doing this. Mr D was really engaged with it but Miss E got a little tired after 30 minutes, which isn’t bad to be fair.
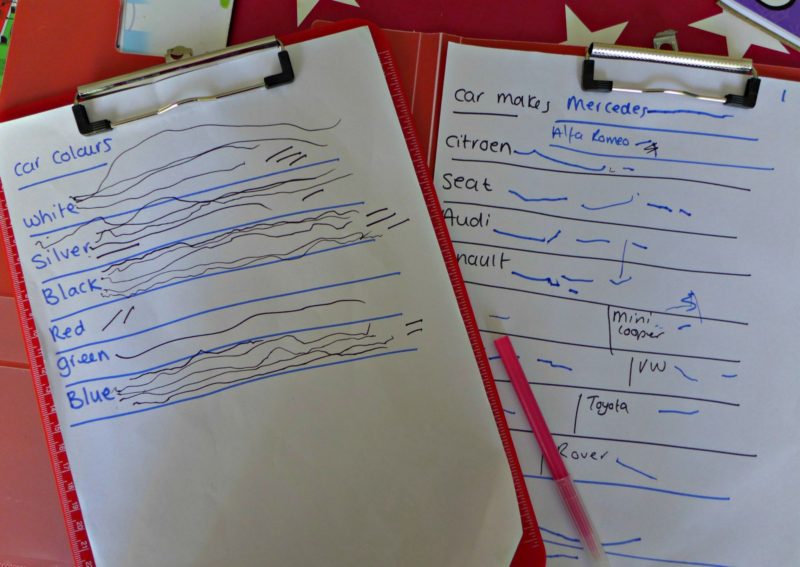
Once we had noted them all down we headed back into the house and we counted them all up. We talked about how we might be able to make it all a bit easier to read and I introduced the ideas of graphs to them. We kept it simple and I drew out the axis for a bar chart for them. They then coloured in the relevant data and were really pleased with themselves when they had done it.
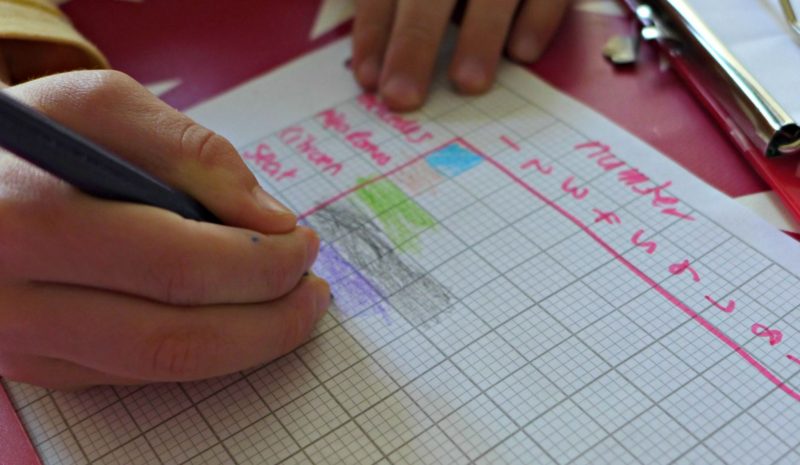
This was a really simple way to introduce data collection and graphs to young children. We might repeat this activity one week-day when there are less (and different) cars on the road and I’ll get them to think about why that could be.




I’m so sorry about the chicken pox hitting your house. That’s awful. Good for you for making the best of it and doing a project with the kids. This is such a great idea for introducing them to graphs! My mind is thinking now of all of the different things my grandson and I could chart.
That’s such a great way to get kids introduced to stats and graphs!
That’s so good.
Sorry the pox has hit. But what a brilliant way to introduce some graphs. Looks like fun was had as well
This is such a fun activity for kids! I might try this with my 2.
Oh no! Sorry to hear about the chicken pox, I hope things are looking up now . I think that working with graphs with pre-schoolers is a great way to get them excited for big school x
Sorry to hear you were all ill! But I like the idea of the graphs 🙂 Nice intro to school life
Chicken pox is terrible 🙁 This looks like a great way to bring maths and graphs into the home and prep them too 🙂 x
Oh NO – chicken pox ;( I remember doing this graph of cars on the road and it was so fun gathering the info!
Thanks for sharing!
Leigh at Fashion Du Jour LDN x
This sounds like so much fun!! And a great way to get them into graphs and statistics at an early age X